Realtime Fallout
RADIOACTIVE FALLOUT PARTICLE MAPS
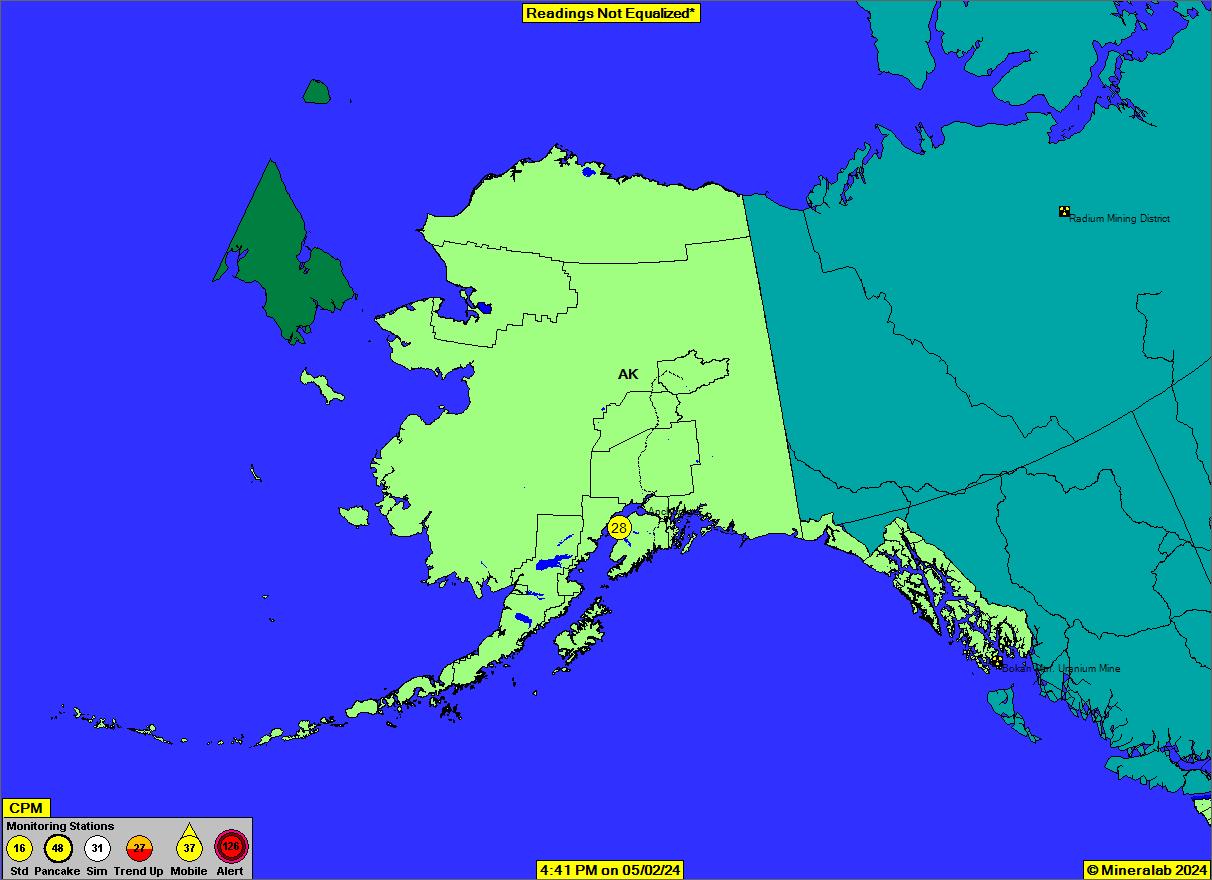
[refresh this page for updated counts]
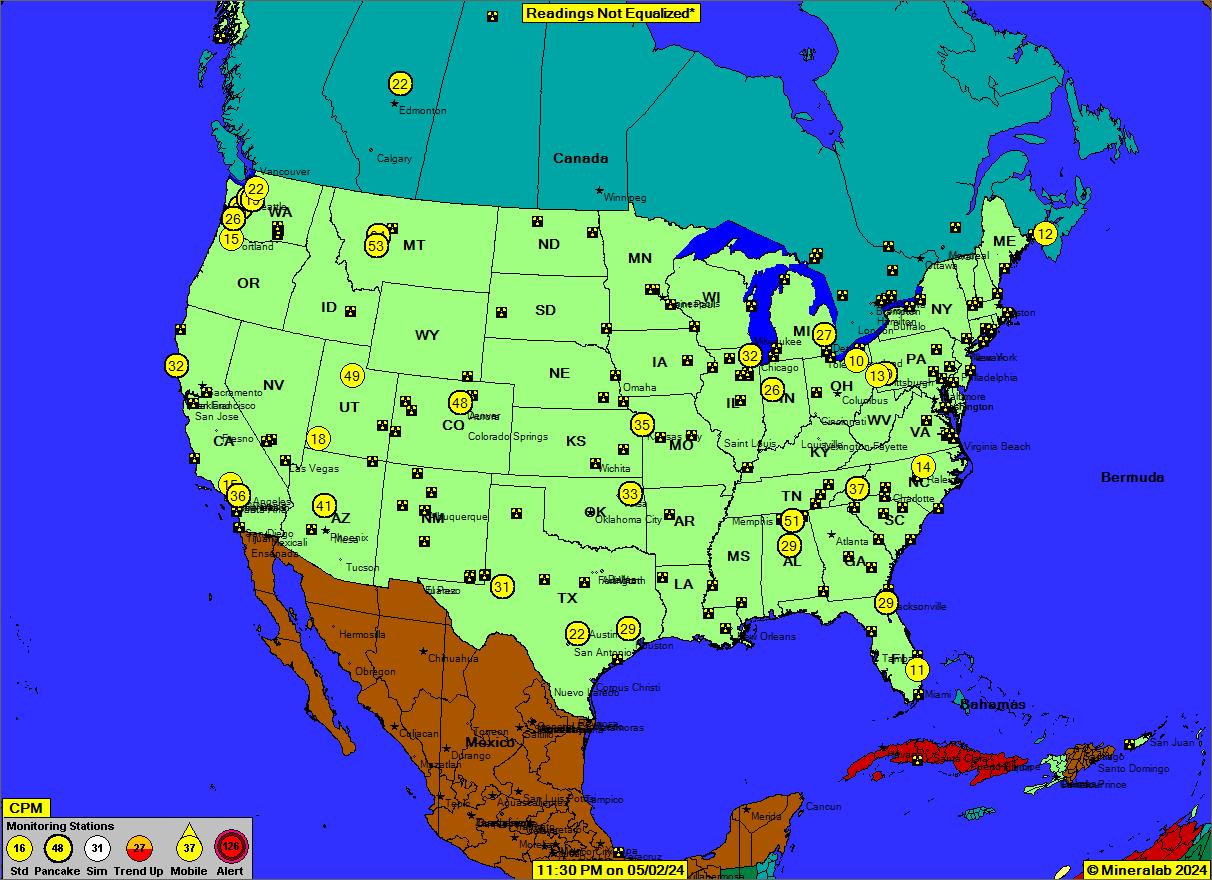
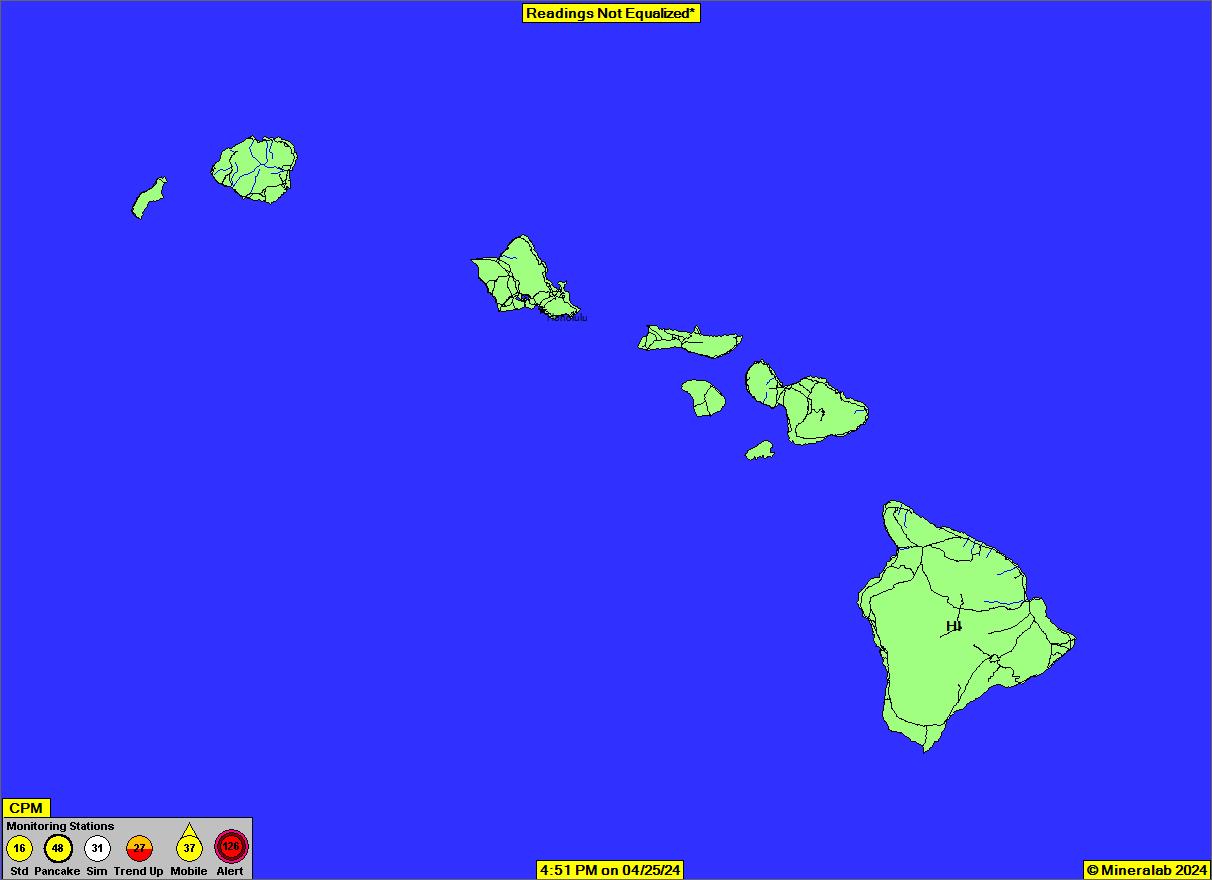
Sourced from http://www.radiationnetwork.com
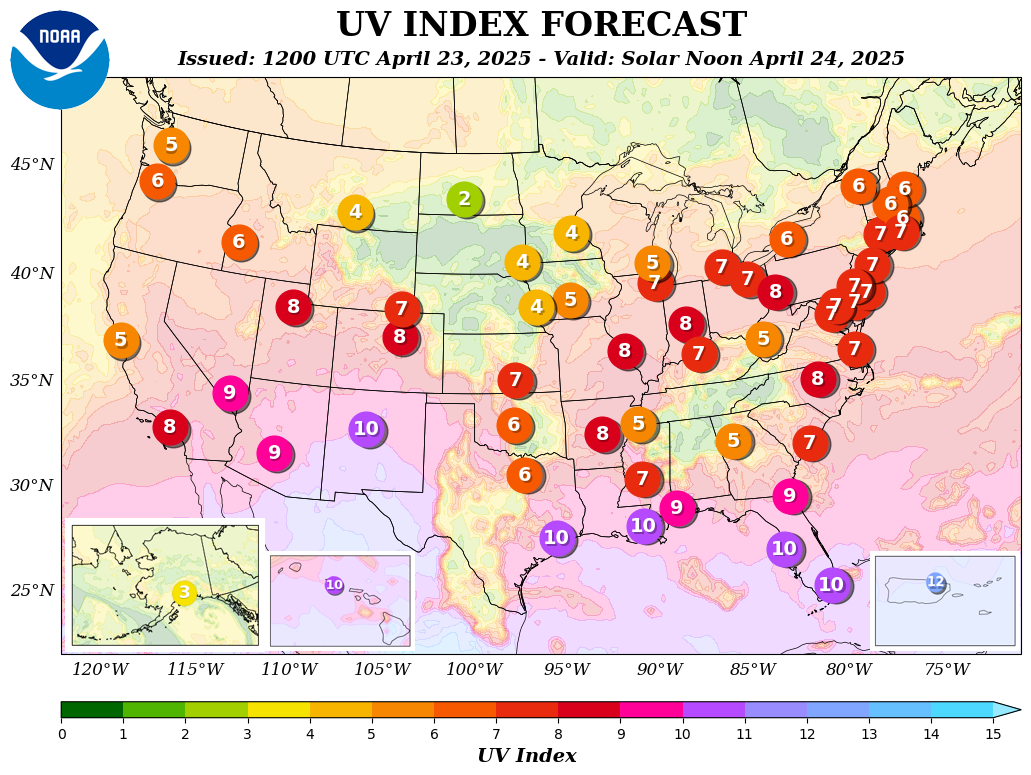
Sourced from SFSU and wunderground.com


Two types of results from EPA.gov's RadNet near-real-time air monitoring are presented below: gamma gross count rate and beta gross count rate. Gamma monitoring results are a more useful indicator of the radionuclides associated with a nuclear power incident. Beta monitoring results indicate when there is a substantial spike in beta activity at this location.


EPA Home: Japanese Nuclear Emergency: Radiation Monitoring:
Updates on EPA's Monitoring Effort
Last updated on Thursday, June 16, 2011
EPA Commentary: Due to the consistent decrease in radiation levels across the country associated with the Japanese nuclear incident, EPA will update this data summary page only when new data are posted... The next round of milk and drinking water sampling will take place in approximately three months...
[Editors note: With at least 6 reactors at or near meltdown in Japan and numerous incidents currently "flooding" the USA, the data below is useful as a reference.]
Sourced from University of Maryland www.atmos.umd.edu
Latest Hysplit run available (What happened to May & June fallout? UMD, we need your updates!)
